%20copy.avif)

Five Diagram Types Every Confluence Team Should Be Using
April 2, 2026
There's a gap in most Confluence spaces between the documentation teams intend to maintain and the documentation that actually gets kept up to date. Pages drift. Process guides become out of date. A new joiner reads the onboarding wiki and has to chase down three people just to understand who owns what and how decisions actually get made.
The missing piece, more often than not, is a good diagram.
Not a highly technical architecture drawing - those have their place, but they're not what most people need most of the time. What teams actually reach for day-to-day are the simpler, more universal visuals: the chart that shows who reports to whom, the flow that explains how a request gets approved, the timeline that lets everyone see where a project stands at a glance. These are the diagrams that make a Confluence space genuinely navigable rather than just technically complete.
Capable Diagrams brings a full diagramming toolkit directly into Confluence - supporting everything from freehand sketching with Excalidraw to structured formats like Mermaid, with AI-assisted creation built in for teams that want to skip the blank canvas entirely. But the tool is only as useful as the habit around it. Here are five diagram types that consistently make the biggest difference for everyday Confluence teams - and how to start using them.
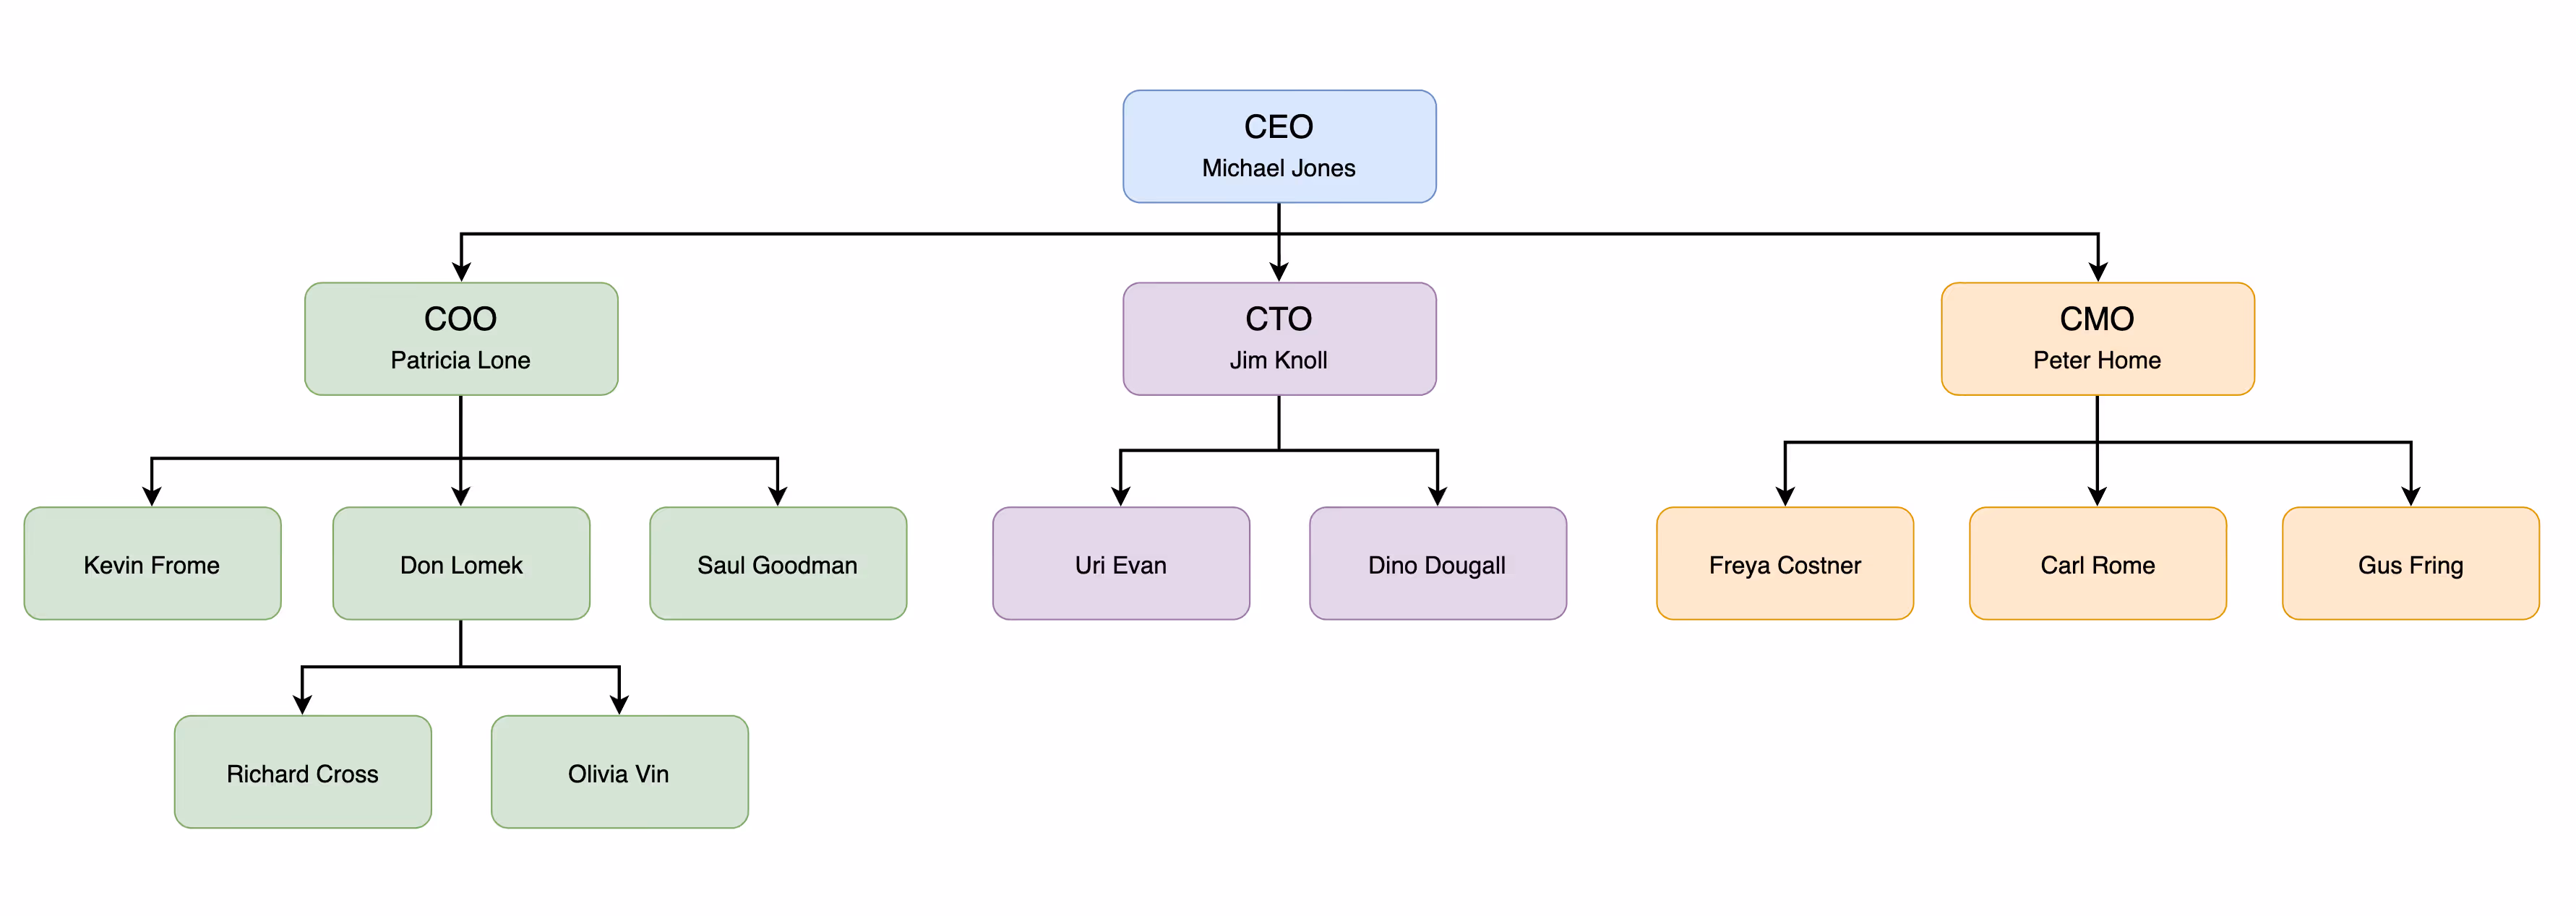
Org Charts and Team Maps
The organisational chart is arguably the most universally useful diagram any team can have, and yet it's one of the most neglected. Most companies either have no org chart at all, or have one that was accurate eighteen months ago and hasn't been touched since.
This matters more than it might seem. When someone joins a new team, or tries to figure out who to loop in on a decision, or needs to understand how two departments relate to each other, they're doing a kind of archaeology - piecing together the picture from email threads, Slack handles, and whoever happens to be available. An up-to-date team map embedded in the relevant Confluence space eliminates most of that friction.
The reason org charts tend to fall out of date isn't neglect - it's that the tooling makes them painful to maintain. When your chart lives in a separate design tool, it gets updated when someone has time, which means almost never. With Capable Diagrams embedded directly in Confluence, the chart lives alongside the team wiki where people already look. Updating it is a minor edit on the page, not an expedition into a separate application.
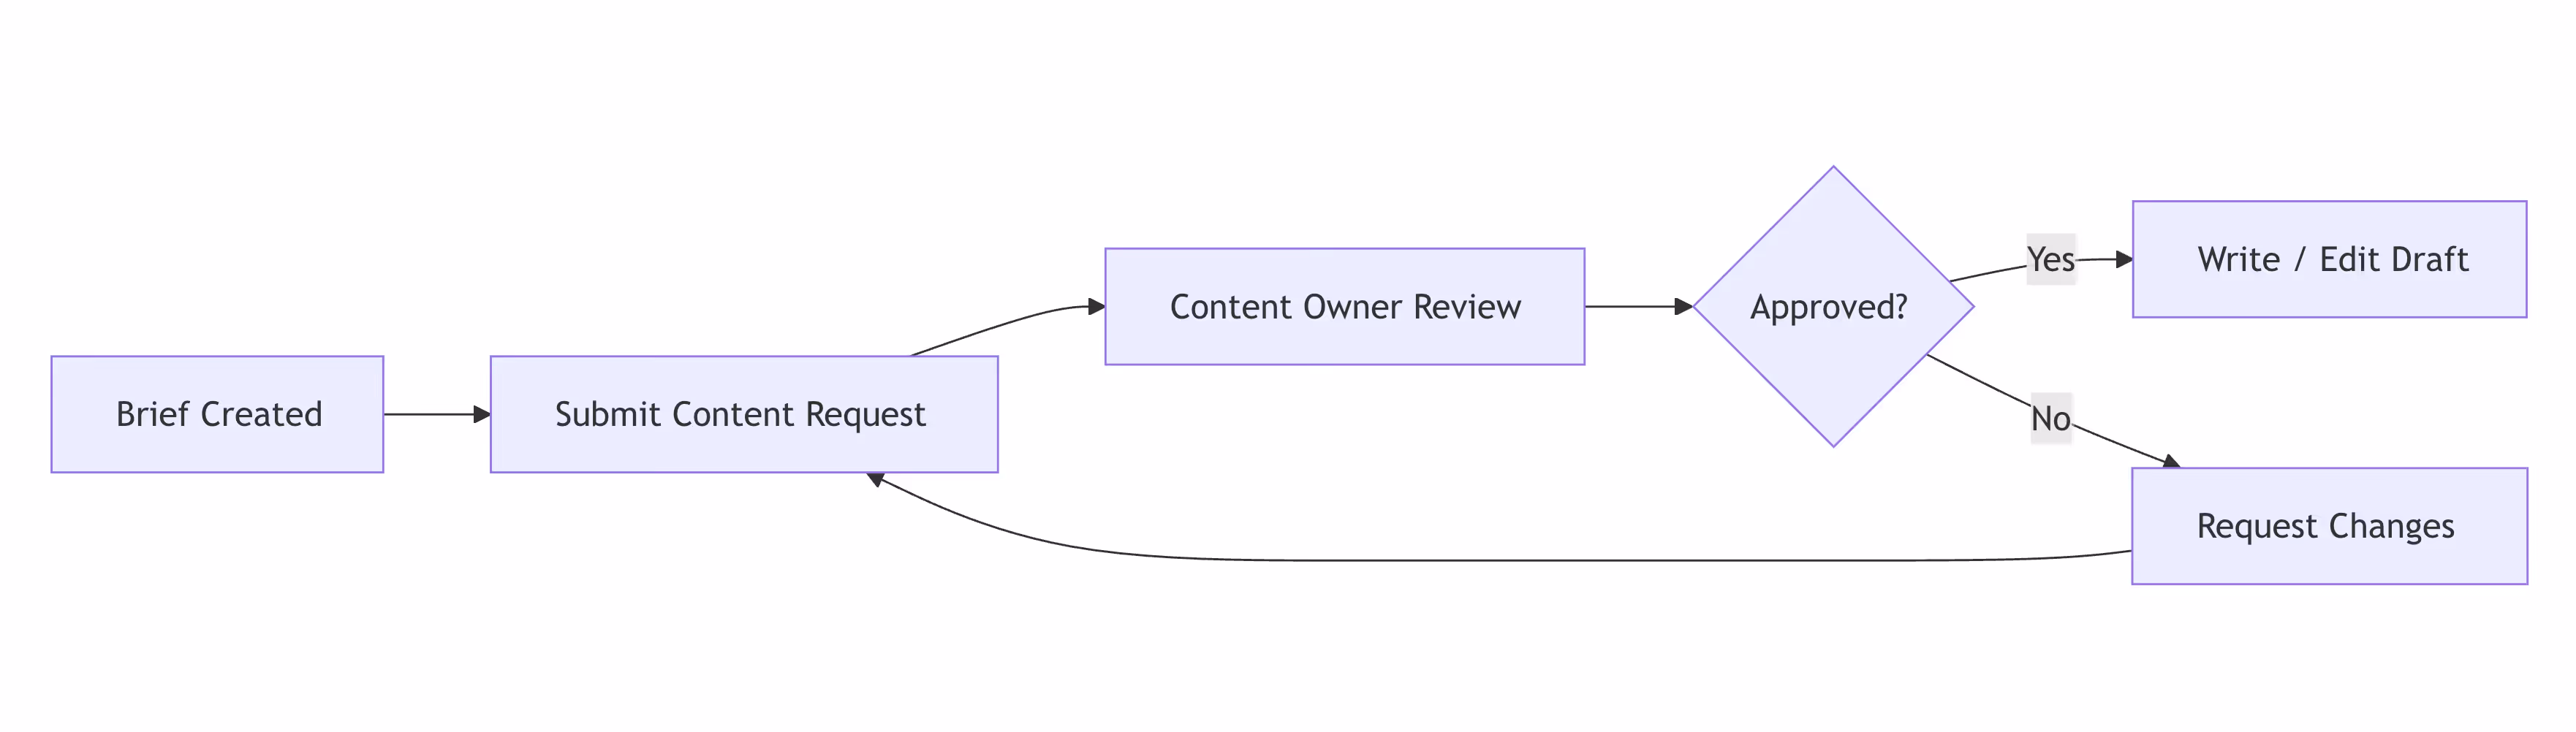
Process Flowcharts
Most teams have processes that live entirely in people's heads. The way a content request moves from brief to published. The steps a bug report follows before it becomes a fix. The approval path a vendor invoice takes before payment is authorised. When these are undocumented, tribal knowledge accumulates in the people who've been around longest - and everyone else improvises.
A process flowchart solves this by making the invisible visible. It doesn't need to be exhaustive or perfectly polished. A simple flow that shows the main steps, the key decision points, and who is responsible at each stage is enough to dramatically reduce the time people spend figuring out what to do next.
Capable Diagrams makes flowcharts fast to build with the visual Excalidraw editor and its built-in shape libraries - or, if your team prefers code-based diagrams, Mermaid's flowchart syntax lets you write a clear flow in minutes. The AI creation feature is particularly useful here: describe the process in plain language and get a working draft instantly, then refine from there.
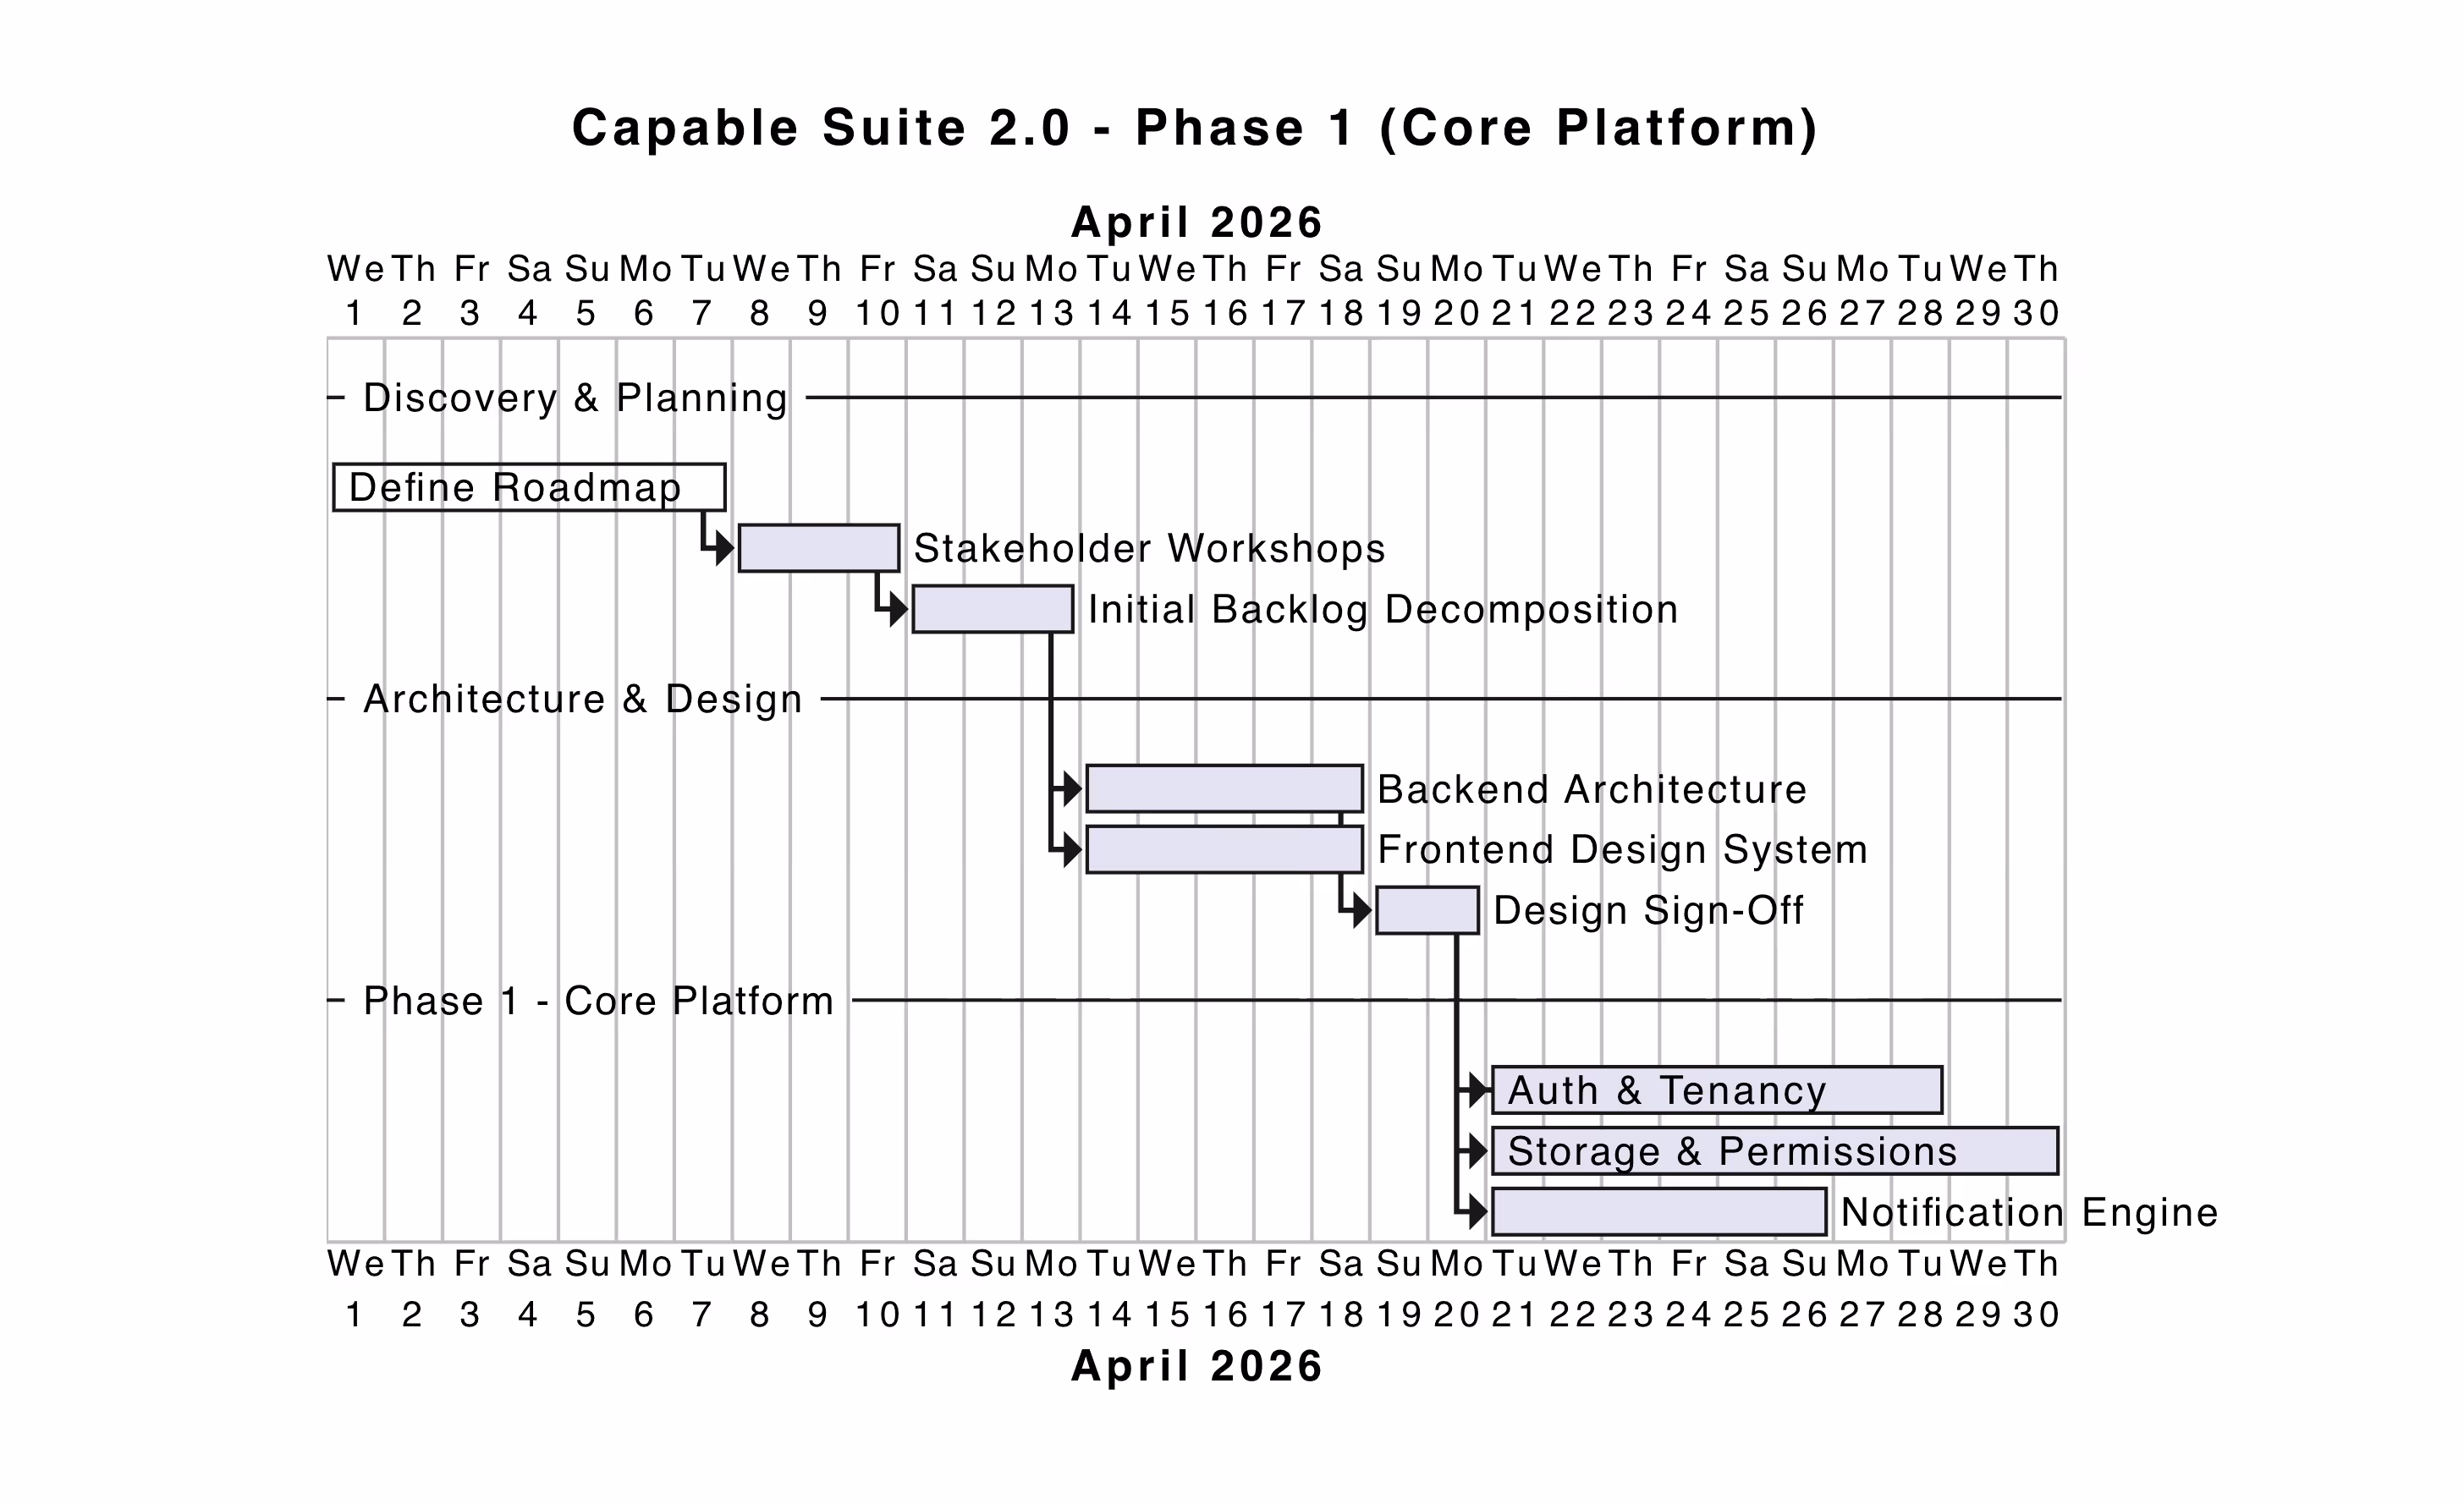
Project Timelines and Gantt Charts
The project timeline is one of the highest-value diagrams a team can embed in a Confluence space, and one of the most underused. Stakeholders want to know where a project stands. They want to see the sequence of milestones, what's been completed, and what's coming next - without having to read through a long status update or sit through a meeting.
A Gantt chart embedded on the project's Confluence page provides exactly that. It gives anyone who lands on the page an immediate orientation in time: what phase are we in, when does the next milestone land, and what's blocking what. For teams that regularly present to leadership or communicate progress to other departments, having a visual timeline on the page is significantly more effective than paragraphs of status text.
Capable Diagrams supports Mermaid and PlantUML Gantt syntax, which produces clean, readable timelines from straightforward notation - and because the diagram lives inside Confluence, updating it as dates shift is as simple as editing the page.
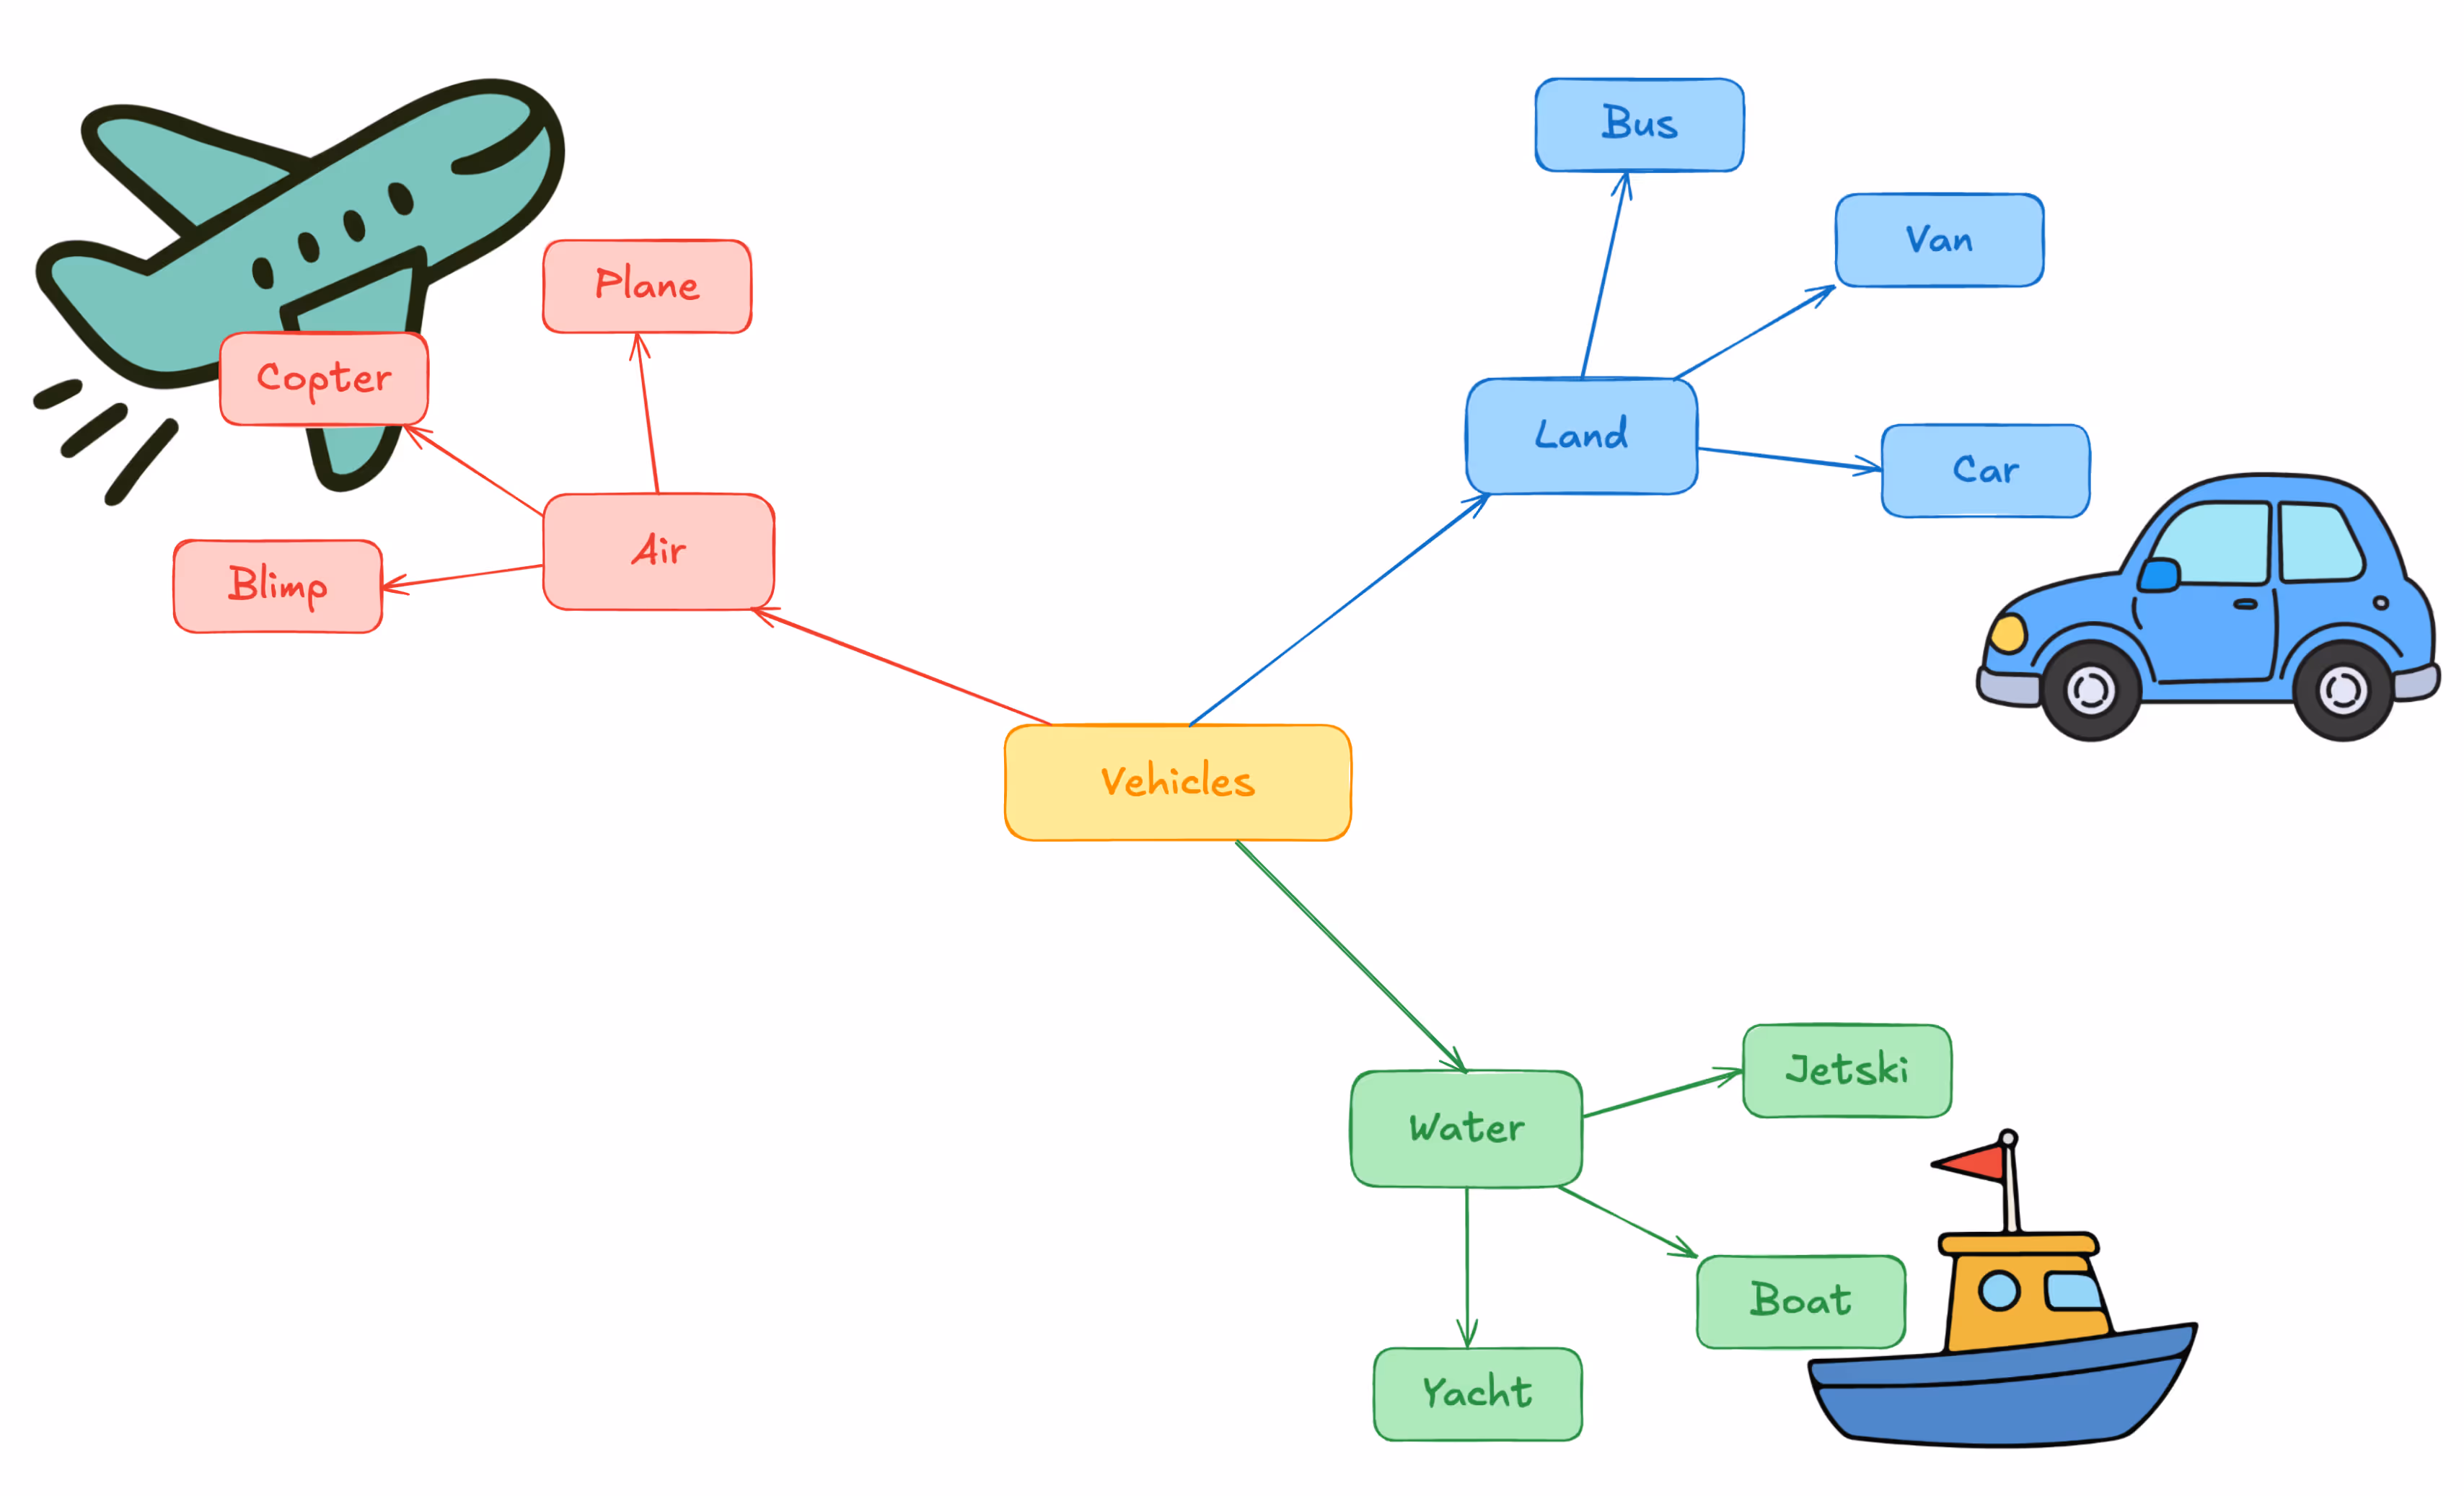
Mind Maps
Mind maps tend to get dismissed as a brainstorming novelty, but they're genuinely useful for a specific category of Confluence page: the kind that exists to make sense of something complex. A product strategy. A set of interconnected topics in a knowledge base. The scope of a new initiative. The relationships between a collection of concepts that don't fit neatly into a list.
What a mind map does that prose can't is make the shape of the thinking visible. It lets a reader see relationships, clusters, and hierarchies at a glance - the kind of orientation that a well-structured paragraph can approximate but never quite replicate. For pages where the goal is "help someone understand how this all fits together," a mind map embedded at the top of the page does the job faster than any amount of careful writing.
Mermaid's mindmap diagram type is supported in Capable Diagrams, and it can be generated quickly with the AI creation feature - describe the topic and its main branches, and you'll have a working mind map to build from.
User Journeys and Customer Flows
Any team working on a product, a service, or a support process benefits enormously from having user journey diagrams in their Confluence space. These aren't purely design artefacts - they're shared orientation documents. When a product manager, a developer, and a support lead are all looking at the same journey map, they're starting from the same understanding of the customer experience, which makes every subsequent conversation faster and better calibrated.
Journey maps work at different levels of fidelity. A high-level flow showing how a new user moves from sign-up to first value is useful for anyone working on onboarding. A more detailed flow showing the steps a customer takes to file a support request helps the support team identify friction points. Neither one requires design expertise to create - just a willingness to draw out what you know and make it visible.
With Capable Diagrams' Excalidraw editor, building a journey map is a matter of placing shapes, connecting them with arrows, and labelling the stages. The result embeds directly in the relevant Confluence page - a product page, a support wiki, an onboarding guide - where anyone who needs it will actually find it.
The Common Thread
None of the five diagram types above require specialist skills. They don't need a dedicated design team, a separate diagramming application, or expertise in visual communication. What they need is a team that's decided to make diagrams a default part of how they document - and tooling that makes that easy enough to actually sustain.
Capable Diagrams brings the diagramming tool directly into Confluence, where the documentation already lives. Every diagram is embedded on the page it belongs to, updated in place, and available to anyone with access to the space. There's no "export and re-upload" cycle, no hunting for the latest version, and no context-switch into a separate tool for a small update.
The five diagram types above are a starting point. Pick the one that your team most conspicuously lacks, create one, and embed it where people will actually see it. The habit builds from there.
Explore the full range of supported formats and features in the Capable Diagrams Help Center, or get started directly from any Confluence page using the Capable macro.
Capable Diagrams is part of the Capable suite of apps for Confluence Cloud - helping teams plan, document, and collaborate without leaving the tools they already use.
.avif)


%20(800%20x%20200%20px).avif)